
The Kings are Dead...
The Legend that is, the very much alive, seventy-two year old,
John Brock
4th UCI Worlds & here (a week later) 2nd in Amy's Gran Fondo
Disclaimer
This is probably going to be one of the more controversial
articles I've written. Which for me, is saying something!
But stick with it, over the coming factsheets, as it's placed in
context, it'll probably make
a little more sense than it first might.
All I'm offering is the truth; nothing more...

Functional Threshold Power ~ A
Historical Perspective
In the good old days, around 2008!, Functional
Threshold Power (FTP) came to the fore as the de-facto measuring
standard, and benchmark, against which almost all other physiological markers
were anchored.
It quickly gained traction as the maximal, sustainable, quasi-steady-state power, you can hold for an hour.
The people who introduced it to us, Dr Andrew Coggan et al, are now telling us this explanation may have been over-emphasised. May? MAY?
 It was absolutely,
one hundred percent, back-of-the-net, generally understood (my first
oxymoron), that FTP was the power you put out over a full hour, no more,
no less.
It was absolutely,
one hundred percent, back-of-the-net, generally understood (my first
oxymoron), that FTP was the power you put out over a full hour, no more,
no less.
An hour, sixty minutes, three thousand six hundred seconds.
Some took it as normalised 60 minute race power, some took it as 95% of your best 20 minute power, others as 90% of your best VO2max power.
But these were all extrapolations, to stop people having to do a full one hour test! No one likes one hour tests, only 25 mile TT riders and triathletes.
To be fair, due to the bell-curve effect of things averaging out in a normal distribution pattern, these extrapolations got close enough for most of the "normal" population most of the normal time.
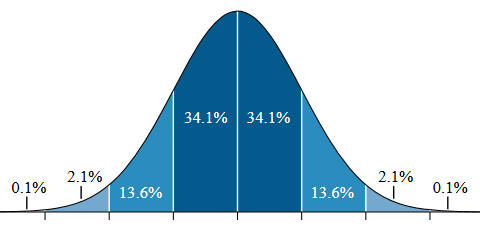
But the more I got in to this power stuff with my own data, and the more I reviewed and analysed the data of others, the more I realised it's not just me. We do not all fit around the centre of this distribution curve.
Statistically 32% of us don't anyway; and that's just for normal people.
This helped me form an early conclusion of my own. Which is why our programmes, our training sessions and our website, have always said, and will always say, IGNORE the numbers.
So the first point of contention we come across is; forget everything you think you know about FTP and how to measure it.
And on that bombshell...
A rider's FTP being tracked over 90 days leading
up to their key objective.
It's FTP Jim, but not as we know it
The "revised (or I should say clarified) definition" of
functional threshold power is that it is "the
maximal, sustainable, quasi-steady-state power, you can hold
without fatiguing".
Which is a substantial mind-shift for some, and a step too far for others! But significantly, or physiologically, it's still the same thing; FTP is a surrogate marker of your muscular metabolic fitness. It just no longer has a real, or perceived, timescale attached to it.
The reason for this redefined FTP clarification is due to the release of a raft of metrics used to model it, measure it, and confirm the accuracy of both it and the parameters around it.
We now know what we didn't know before; or to be more precise, we can now prove what we thought we suspected before, but didn't have the tools to go about showing, or proving, it.
With the long-awaited release of WKO4, we now have a step change in the analytics we can undertake on the data we previously had.
The way we can manage and manipulate that data and how we can present it back to the rider, has changed enormously in the past year.
But to make best use of the old data, and the new concepts we want to apply, we have to re-align our previous physiological understandings and metabolic compartmentalisation classifications. It's not just FTP that's had its definition "re-classified".
Let Me Level With You...
Previously, we had Coggan's Power Levels. You've seen them
all over our programmes and beyond. Here we have one hundred hours
of a rider's Base Build Programme, segmented in to physiological levels, as we previously
understood them.
The breakdown of a 100 hour Base Build Period with Classic Levels
Here's how the power levels above, are broken down in to the designated physiological bins for a "normal" rider with an FTP of 250 watts...
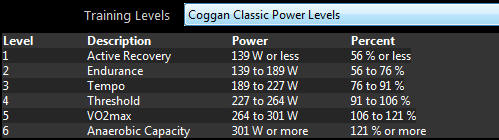
All the levels above are relative to an individual rider's FTP; taking their baseline from what we know now was a slightly flawed(?) (misunderstood) concept. But the levels were at the same breakpoints for everyone.
Close enough for most of our purposes, but not necessarily bang on the money for all of us; as (we saw from the bell curve above) one size most definitely doesn't fit all.
With the advent of new science and technology, and the software to analyze and make best use of those advances, we now have a much more accurate way of describing and collating the physiological responses to the work we undertake on the bike.
Our "newly" refined FTP has also brought along a new, accompanying, refined "levels" system. Which means the previous levels, which served us well, are now referred to as "Coggan's Classic Levels".
What we now have are Coggan's "individualised" levels, or iLevels...
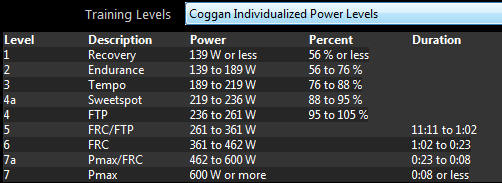
As you can see, there are quite a few more levels, and an extra time column tagged on the side! Here's what they are and why they are...
Every level below (aerobic) FTP still uses the same (but re-defined) anchor point, FTP itself. Recovery and Endurance remain the same, running from under 56% to up to 76% of your FTP.
We used to go from Tempo to Threshold, which referred to "Lactate Threshold" another nomenclaturaly challenged (and flawed), surrogate marker. These two previous levels are now modified and/or lost, with another more relevant marker added.
A little shuffle of the numbers has taken place, to accommodate "Sweet Spot". The area we were all aware of, but were never quite sure of its definitive place.
Tempo, still runs from 76%, but now stops at 88 as opposed to the previous 91. This is to allow the much used Sweet Spot marker to drop in to the created gap, running from 88 to 95%.
Threshold is "lost" and a new, FTP, level has been "created" to run from 95 to 105% of FTP. You can push FTP up from underneath, or drag it up from above, depending which end of the level you attack it from.
I'm sure you all agree what we have so far is reasonable, understandable and better reflects what you are feeling when on a bike. And I'll take this opportunity to remind you all that this is a continuum, not a delineated "you're in one or the other" box. Here's a quick visual synopsis...
Coggan's Comparator
Okay, that's the aerobic stuff sorted. Now it's time to get down to the anaerobically funky, suffering well-type stuff.
 I
am a name not a number...
I
am a name not a number...
Classic
Levels five and six, VO2max & Anaerobic Capacity are now
removed and segmented
in to more clearly defined areas.
To me, it was always strange to use an aerobic (with oxygen) based parameter to define an anaerobic (without oxygen) power level.
It was like trying to guess how much you had in your bank account by looking at the balance on your credit card.
But at the time there was no better way to do it; it was all we had.
Now, Dr Coggan and his team have released us from the bonds of "predictive restrictive" cookie-cutter levels and allowed us to proactively model them on our own data and our own physiology.
No longer are we prisoners to a one-dimensional system, as good as it was, that locks us to a one size fits all methodology.
Taken from each individual rider's Mean Maximal Power Curve, which we'll come to a little later, we can now more accurately measure, track and pro-actively predict an individual's physiology. Using their own actual power data and numbers from their own rides.
These "new" levels, are now time based and fall around three markers. FTP, FRC and Pmax.
FTP, we already know, it's Functional Threshold Power, we've just redefined and "clarified" its meaning!
Pmax, is the "proper" highest power output you can achieve; it's the power released from one complete rotation of each leg!
Due to recent technological advances, this is something we can now measure across almost all platforms; previously only SRM's allowed this.
Before, all we had was max power; the highest "one second spike" you could achieve, and different systems measured this in different ways. If you were on a steep incline in a big gear at 45 rpm, then you could very well just measure, three quarters of a pedal rev.
Pmax is not "maximum power", it's the average combined power output from each leg, for one full pedal revolution. Pmax is a perfect marker!
Between FTP and Pmax we have FRC.
This is the same as above, it's just here to make it easier to follow the text...
FRC is Functional Reserve Capacity; basically how hard, for how long, you can go above FTP. This is measured in kilojoules not watts. These diverse metrics are related, I'll run a separate factsheet on this soon.
FRC is at or around VO2max, and is a really important metric. For some events, this needs to be as high as you can get it. For others, it's not so critical. If you're doing a 100 mile Time Trial, you shouldn't be hitting FRC!
Between these three new markers, we have sub-levels, Where we "transition" from one marker to the next almost seamlessly. Each sub-level becoming an acronym driven portmanteau, taking it's name from the levels above and below it.
Here we can see the exact same person, during the exact same hundred hour base build programme, with the exact same power files compared across the two differing classification systems.
Classic levels above, iLevels below...
Same data, different perspective. Now you can see the clarity of focus we have with the new levels.
Data, plus context, equals information.
The four levels to the left of Threshold, in the upper chart, and FTP in the lower chart, are all aerobic and directly related to FTP itself.
The four ilevels to the right of FTP in the lower chart (there is nothing in the Pmax column as this is Base Build data) are now time and energy based and are freed from the shackles of FTP comparison.
The new anaerobic markers are all relevant to the individual and their unique physiological make up. Even if you had two riders with the exact same FTP, their anaerobic power outputs could be vastly different. As we're about to see...
Mean Maximal Power Curves
No two riders will show a power spectrum with
the same percentages at any given specific timeframes. Here
are two riders, one male, one female, both champions in their
(differing) fields and both on top of their game.
For clarity (and speed) I'm just showing the one minute marker, across their 60 minute Mean Maximal Power Curve...
Scores on the Female Doors...
▼ mFTP ~ 233 watts (3.25 w/kg)
▼ Predicted 60 sec power ~ 344 watts 147% of mFTP
▼ Which is 182% of actual 60 minute power
▼ Which is 158% of actual 20 minute power
Scores on the Male Doors...
▼ mFTP ~ 338 watts (3.58 w/kg)
▼ Predicted 60 sec power ~ 608 watts 180% of mFTP
▼ Which is 200% of actual 60 minute power
▼ Which is 181% of actual 20 minute power
It's clear to see that the one minute (anaerobic) power of these two riders has no direct mFTP correlation (147% v 180%); they're not even close. Neither is the relationship of their twenty or sixty minute outputs.
If you look at their 180%(ish) of mFTP power figure; for the lady that matches her 60 minute power, whereas for the man, it matches his 20 minute power output.
This reflects the larger lung and muscle capacity of the male rider; before we get in to the 30% weight differential!
You will also see on the male rider's chart, their actual (white) 60 minute horizontal power marker line is much closer to their (orange) modelled FTP line than it is on the females.
And more bizarrely, the male riders 20 minute power is within 1% of their mFTP. But remember, FTP isn't 60 minute power anymore, we're just using these as relative reference points, not absolute markers. Yet another vindication of the "ignore the numbers" principle.
Prediction v Reality
Finally, here's another rider's mean maximal power curve, with predicted in
red, and their actual in yellow.
It's clear to see we need to do work in the Pmax area (sub 3 seconds) and the (30 second) FRC/Pmax area; 30 sec SMInts it is then!
Working in these areas will force the red curve up and to the right, but it may, due to the sigmoidal nature of these things, suppress another area of the curve, which we might then have to go off and explore. But only if our key objective should demand it.
So you've seen three different riders, with three very different power curves, profiles and percentages. It's so very easy to chase your tail if you take all these numbers and parameters literally. Gathering data is a science, applying it is an art.
I'm not one to say...
At last, after seventeen years of telling people to
ignore the numbers they'd spent a
fortune gathering, I have now, in just a few little charts, and one
vertical line, shown you why it's a good idea.
Your 60 minute power curve is like a fingerprint. I must admit, the curves above look very similar, but once you've seen hundreds of them, you can quickly spot the material differences.
Look at how the (lower) male curve is higher and flatter from one to twenty seconds; showing low muscular fatigue.
Whereas the (upper) female curve is flatter and shallower after the one minute marker, showing less aerobic fatigue, and better efficiency, for any given aerobic effort. We're all good at something.
Also, where the red curve drops below the orange horizontal line, is another key marker and something I will cover over the coming factsheets.
In the top (female) chart, red drops below orange at 27:43, in the lower (male) chart, it crosses at 37:08. So what's going on there then?
That's for another day. Don't want to bore you too much today...

The Message
There we have it. FTP isn't FTP anymore, and levels aren't
levels. It's now mFTP and iLevels.
We now have the ability to more accurately model our inputs and responses. Which is better than shoehorning a (logical) formula, and some reasoned (but fixed) percentages, to make them fit our desires.
Allocated FTP, was as accurate to power outputs as 220-age was for heart rate predictions. In the same way that doctors (in light of evidence most of us suspected) have now stopped blaming fat consumption for obesity, we've stopped using an aerobic formula to predict anaerobic power performance.
That may be a little harsh, because allocated FTP had some sort of science behind it. Well the science has moved on and so must we.
Training is nothing more than "the application of a specific level of "effort" to elicit a specific physiological response and adaptation".
Ramp Test ~ always a good way to get the data you want
The more accurately we can predict the effort required, (through our own data or ramp tests) the more accurate we can target our training and the more specific we can target the desired outcome.
And what better way to predict the effort you are capable of, than using the data you have provided yourself. We are all unique and we all require a different "stressor" to increase our performance in a specific area.
If you haven't got a power meter, it doesn't matter. You can still make use of this information as it will help you understand what happens to you at any given physiological level.
As I'm always saying; Anqueteil, Merckx and Hinault never had power meters. All a power meter does is track what you've done. You can still do it, it's still there, you just don't have a fancy number to attach to it.
This is just the start; more to come soon.
Keep safe and keep unique. Because you're worth it. Until next time...
And in case you're wondering how this affects your current training programmes...